Receipts attached 6 sources
Sources
-
Other source
Summary Statistics on Port Traffic, September 2026
Monthly container table ends in August; the August volume and empty share are preliminary.
-
Other source
Port of Hong Kong container throughput surges as Asian port congestion continues
Source for the reported September figure; it has not yet appeared in the official monthly table.
-
Other source
Port of Hong Kong sees unprecedented growth in cargo throughput in August
Attributed account of the congestion and additional service.
-
Other source
Half-year 2026 results presentation
-
Other source
Port operational update, 14–20 October 2026
-
Other source
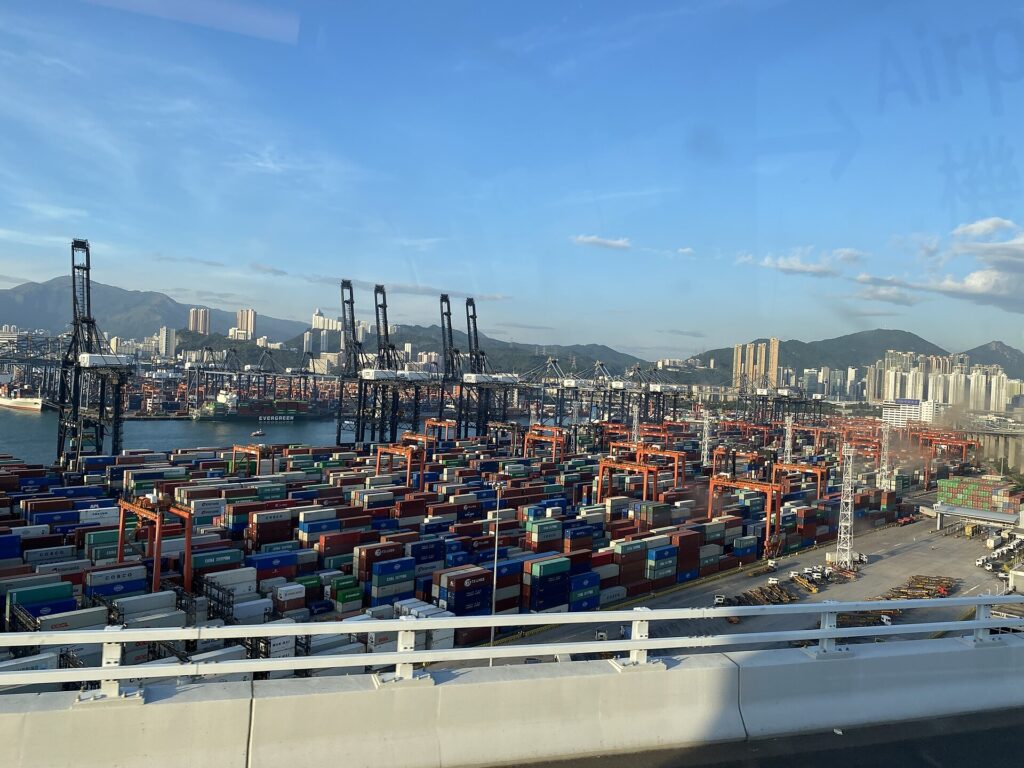
Kwai Tsing Container Terminal, October 2020
Archival contextual image; see the featured-media caption.

Limits
September throughput is from a single trade-publication report and is not yet in the official monthly table. Nine-month growth and laden/empty changes are calculations from rounded published figures. Regional congestion is a plausible contributor, not a measured allocation of diverted cargo.
Corrections
No correction notes have been added for this article.
Hong Kong’s container port has logged two sharp year-on-year gains, but the numbers do not yet show a lasting recovery. Mainland port delays helped make Hong Kong a place for ships to catch up. Those delays are now easing.
The port handled 1.278 million twenty-foot equivalent units, or TEU, in August, up 22.1 percent from a year earlier, according to the Hong Kong Maritime and Port Development Board’s September bulletin. Hong Kong Maritime Hub reported 1.185 million TEU for September, up 24.9 percent year on year. September’s volume was lower than August’s; the second jump was against an especially weak September 2025.
At the end of June, throughput for 2026 was down 3.0 percent. The official cumulative total had edged 0.2 percent ahead by August. Adding the trade publication’s September figure to the official August total yields about 9.93 million TEU for the first nine months, roughly 2.6 percent above the comparable 2025 total calculated from the bulletin’s rounded monthly figures. That nine-month comparison is an estimate until September appears in the official table.
A weak base, and a genuine increase
The year-on-year percentages flatter the rebound because August and September 2025 were down 8.5 percent and 14.7 percent respectively. But the gains do not vanish against an earlier benchmark: August 2026 was about 11.6 percent above August 2024, while the reported September 2026 figure was about 6.6 percent above September 2024.
August was also 17.5 percent above July 2026. The official table puts Kwai Tsing terminal throughput at 958,000 TEU, up 22.8 percent from August 2025, and mid-stream and other berths at 320,000 TEU, up 20.1 percent. Those figures establish the scale and breadth of the increase. They do not establish how much business Hong Kong has permanently won from rival ports.
More boxes, including empties
Empty containers made up 22.3 percent of Hong Kong’s August throughput, compared with 17.6 percent a year earlier, the official bulletin shows. Applying those rounded shares to the monthly totals suggests empty-container volume rose by about 55 percent, against roughly 15 percent for laden containers. Empties accounted for about 44 percent of the extra TEU by that calculation. Repositioning is one plausible explanation, but the aggregate data do not identify why each box moved.
Hong Kong Maritime Hub attributed August’s surge partly to congestion at Shanghai and Ningbo and to an additional service. Its account fits the timing, but it is not a measure of how many diverted containers Hong Kong handled. Before the surge, Hutchison Port Holdings Trust reported that combined first-half throughput at HIT, COSCO-HIT and Asia Container Terminals was down 5 percent, while Yantian’s was up 10 percent.
The next test
The pressure at the mainland ports is changing. In its 14–20 October update, Kuehne+Nagel put seven-day average vessel waits at 2.14 days in Shanghai, 1.95 in Ningbo and 1.11 in Hong Kong. It said congestion had eased as backlog vessels and cargo were cleared, although Hong Kong terminal yards remained 80 to 85 percent utilized. A shorter queue does not mean every schedule is back to normal, but it weakens the case for treating disruption-driven volumes as permanent.
October’s throughput and the share of empty containers will provide a better test than another year-on-year headline alone. If laden volumes remain strong as mainland waits fall, Hong Kong has a stronger claim to a sustained rebound. For now, two good months show that the port can absorb more work. They do not show how much of that work will stay.